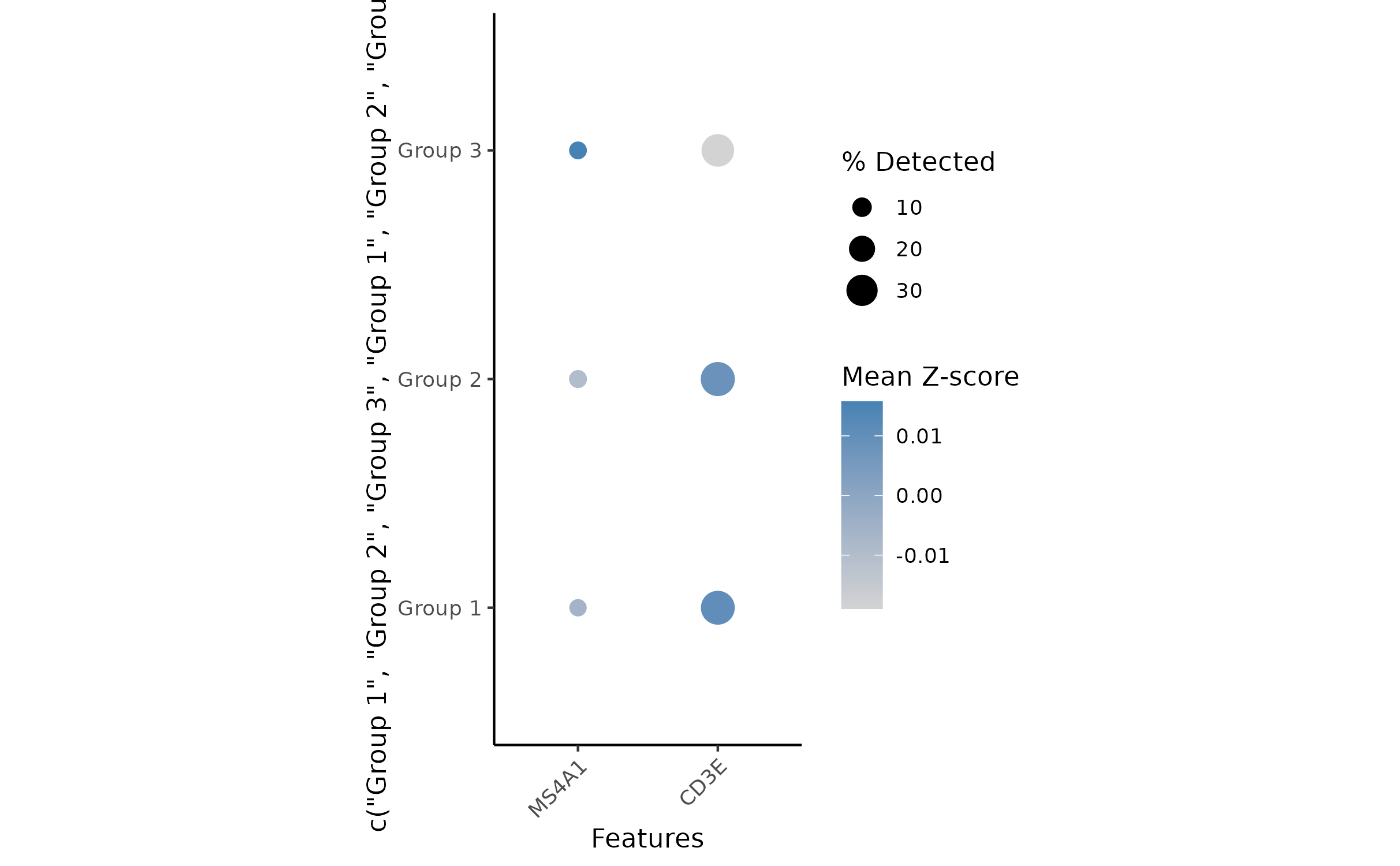
Plot feature levels per group or cluster as a grid of dots. Dots are colored by z-score normalized average expression, and sized by percent non-zero.
Usage
plot_dot(
  source,
  features,
  groups,
  group_order = NULL,
  gene_mapping = human_gene_mapping,
  colors = c("lightgrey", "#4682B4"),
  return_data = FALSE,
  apply_styling = TRUE
)
Arguments
- source
Feature x cell matrix or data.frame with features. For best results, features should be sparse and log-normalized (e.g. run
log1p()so zero raw counts map to zero)- features
Character vector of features to plot
- groups
Vector with one entry per cell, specifying the cell's group
- group_order
Optional vector listing ordering of groups
- gene_mapping
An optional vector for gene name matching with match_gene_symbol().
- colors
Color scale for plot
- return_data
If true, return data from just before plotting rather than a plot.
- apply_styling
If false, return a plot without pretty styling applied
Examples
## Prep data
mat <- get_demo_mat()
cell_types <- paste("Group", rep(1:3, length.out = length(colnames(mat))))

## Plot dot
plot <- plot_dot(mat, c("MS4A1", "CD3E"), cell_types)

BPCells:::render_plot_from_storage(
  plot, width = 4, height = 5
)