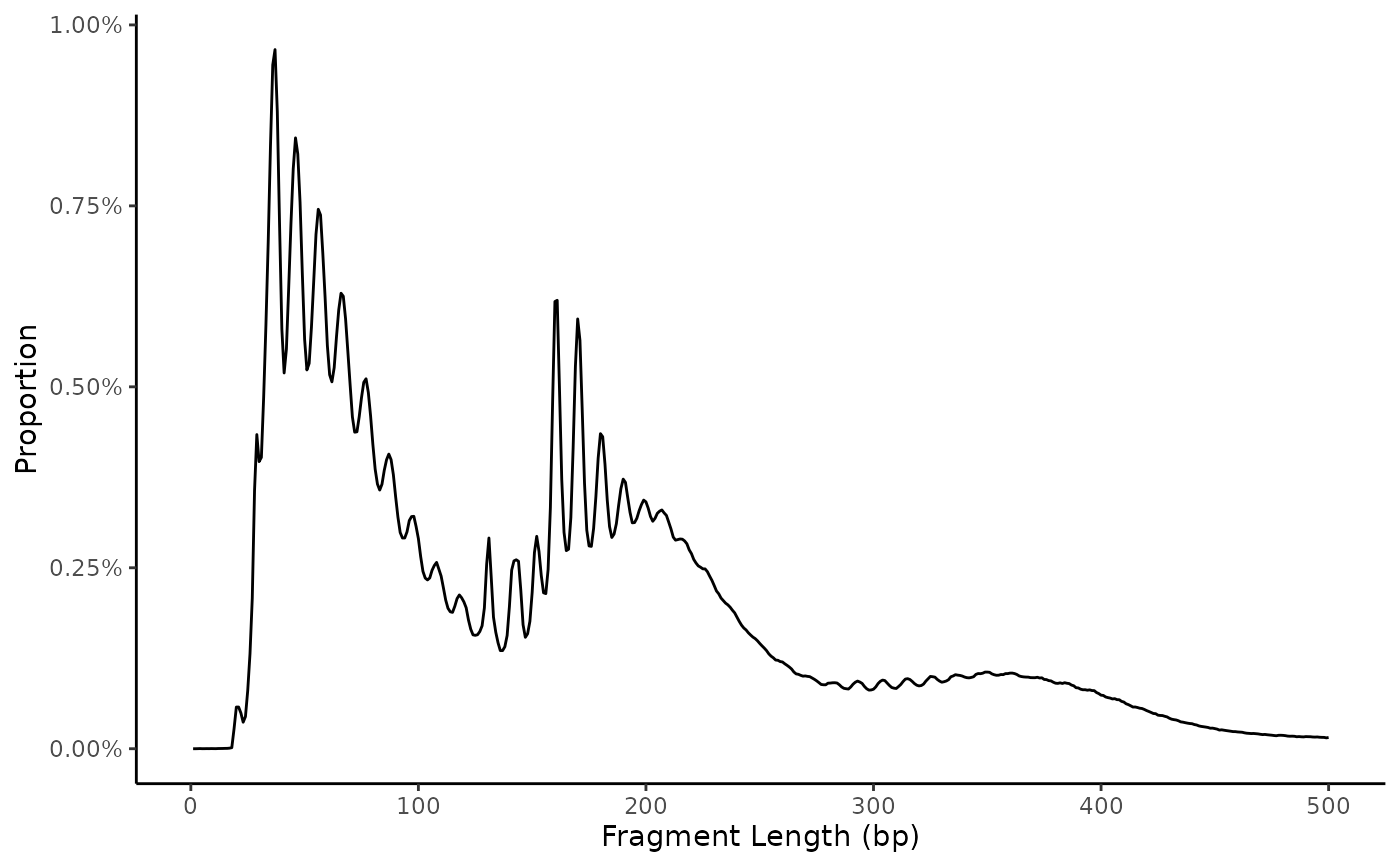
Plot the distribution of fragment lengths, with length in basepairs on the x-axis, and proportion of fragments on the y-axis. Typical plots will show 10-basepair periodicity, as well as humps spaced at multiples of a nucleosome width (about 150bp).
Usage
plot_fragment_length(
  fragments,
  max_length = 500,
  return_data = FALSE,
  apply_styling = TRUE
)Examples
frags <- get_demo_frags(filter_qc = FALSE, subset = FALSE)
plot_fragment_length(frags)