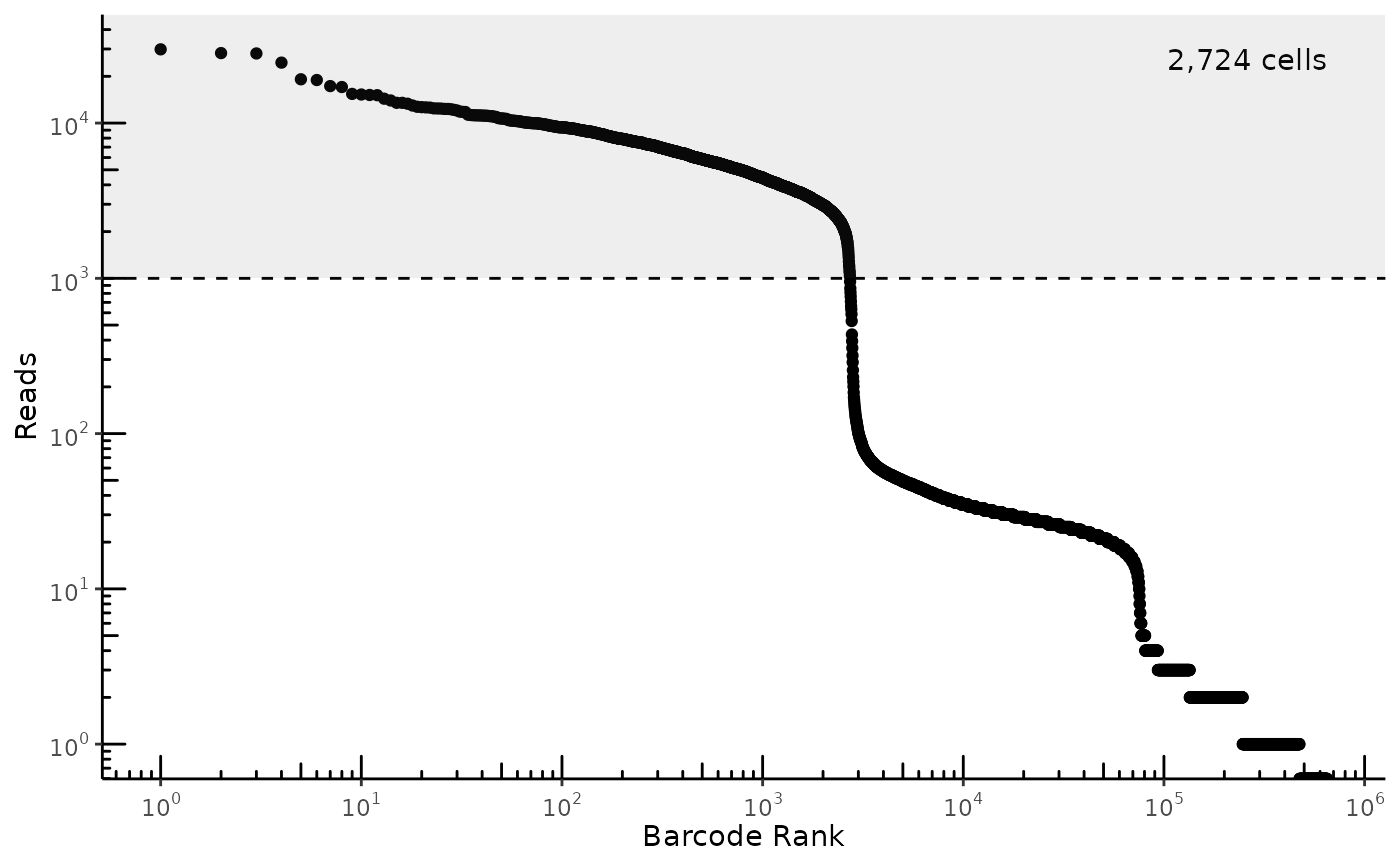
Plots read count rank vs. number of reads on a log-log scale.
Examples
## Prep data
mat <- get_demo_mat(filter_qc = FALSE, subset = FALSE)
reads_per_cell <- colSums(mat)

# Render knee plot
plot_read_count_knee(reads_per_cell, cutoff = 1e3)
Plots read count rank vs. number of reads on a log-log scale.
## Prep data
mat <- get_demo_mat(filter_qc = FALSE, subset = FALSE)
reads_per_cell <- colSums(mat)
# Render knee plot
plot_read_count_knee(reads_per_cell, cutoff = 1e3)
