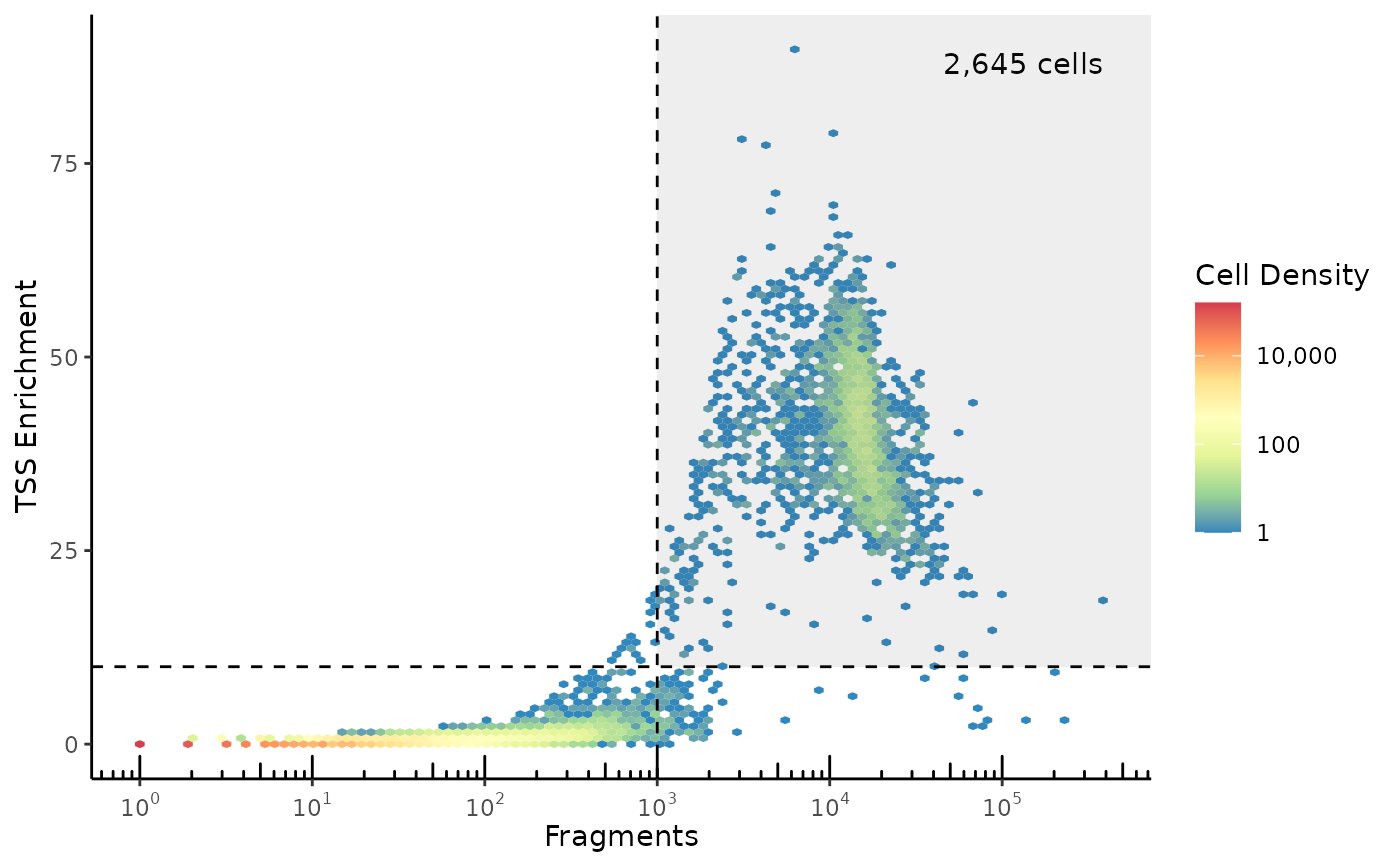
Density scatter plot with log10(fragment_count) on the x-axis and TSS enrichment on the y-axis. This plot is most useful to select which cell barcodes in an experiment correspond to high-quality cells
Usage
plot_tss_scatter(
  atac_qc,
  min_frags = NULL,
  min_tss = NULL,
  bins = 100,
  apply_styling = TRUE
)
Arguments
- atac_qc
Tibble as returned by
qc_scATAC(). Must have columnsnFragsandTSSEnrichment- min_frags
Minimum fragment count cutoff
- min_tss
Minimum TSS Enrichment cutoff
- bins
Number of bins for density calculation
- apply_styling
If false, return a plot without pretty styling applied
Examples
## Prep data
frags <- get_demo_frags(filter_qc = FALSE, subset = FALSE)
genes <- read_gencode_transcripts(
  file.path(tempdir(), "references"), release = "42",
  annotation_set = "basic",
  features = "transcript"
)
blacklist <- read_encode_blacklist(file.path(tempdir(), "references"), genome="hg38")
atac_qc <- qc_scATAC(frags, genes, blacklist)


## Render tss enrichment vs fragment plot
plot_tss_scatter(atac_qc, min_frags = 1000, min_tss = 10)