Combines multiple track plots of the same region into a single grid.
Uses the patchwork package to perform the alignment.
Arguments
- tracks
List of tracks in order from top to bottom, generally ggplots as output from the other
trackplot_*()functions.- side_plot
Optional plot to align to the right (e.g. RNA expression per cluster). Will be aligned to the first
trackplot_coverage()output if present, or else the first generic ggplot in the alignment. Should be in horizontal orientation and in the same cluster ordering as the coverage plots.- title
Text for overarching title of the plot
- side_plot_width
Fraction of width that should be used for the side plot relative to the main track area
Value
A plot object with aligned genome plots. Each aligned row has the text label, y-axis, and plot body. The relative height of each row is given by heights. A shared title and x-axis are put at the top.
Examples
## Prep data
frags <- get_demo_frags()
## Use genes and blacklist to determine proper number of reads per cell
genes <- read_gencode_transcripts(
file.path(tempdir(), "references"), release = "42",
annotation_set = "basic",
features = "transcript"
)
blacklist <- read_encode_blacklist(file.path(tempdir(), "references"), genome="hg38")
read_counts <- qc_scATAC(frags, genes, blacklist)$nFrags
region <- "chr4:3034877-4034877"
cell_types <- paste("Group", rep(1:3, length.out = length(cellNames(frags))))
transcripts <- read_gencode_transcripts(
file.path(tempdir(), "references"), release = "42",
annotation_set = "basic"
)
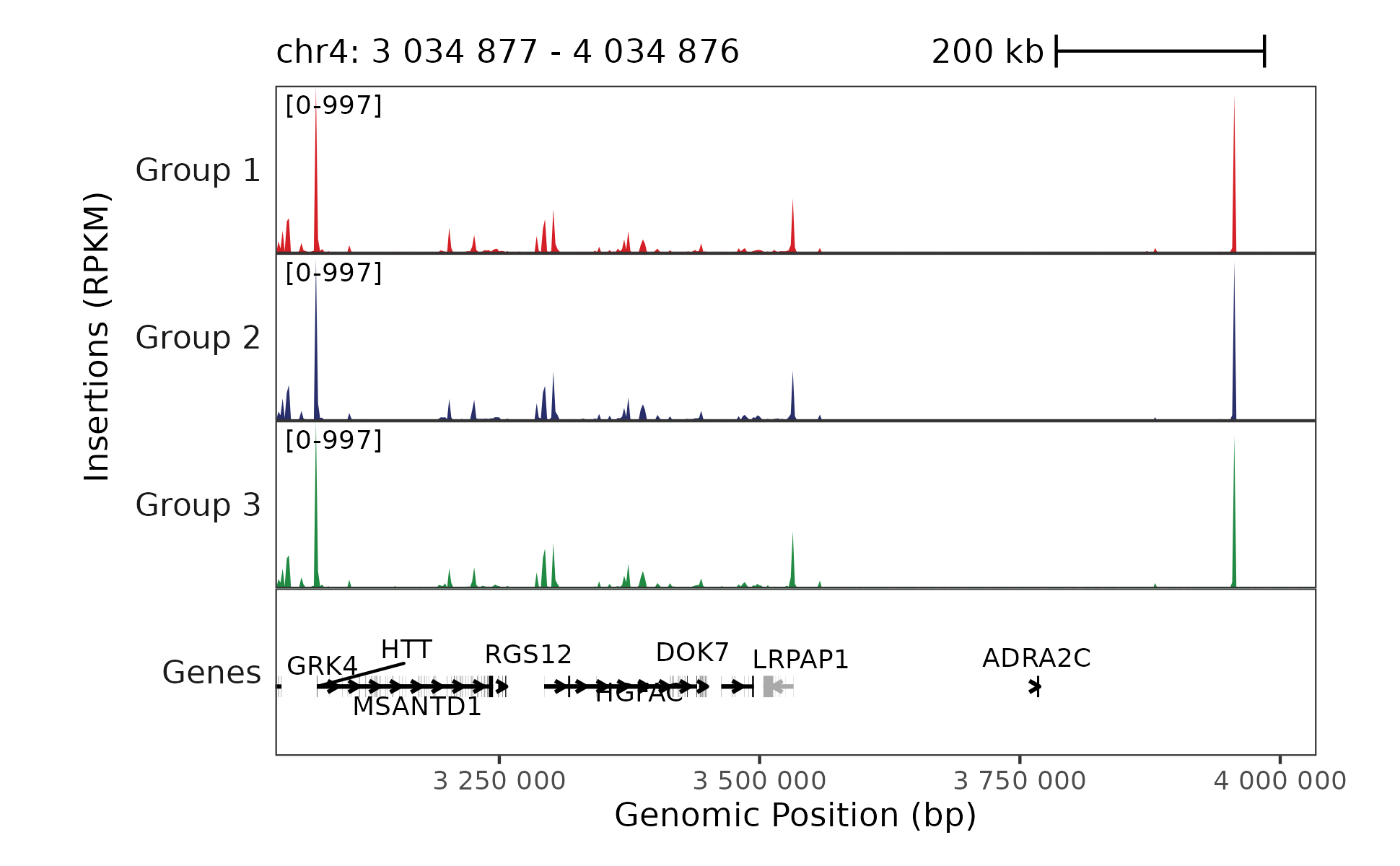
region <- "chr4:3034877-4034877"
## Get all trackplots and scalebars to combine
plot_scalebar <- trackplot_scalebar(region)
plot_gene <- trackplot_gene(transcripts, region)
plot_coverage <- trackplot_coverage(frags, region, groups = cell_types, cell_read_counts = read_counts)
## Combine trackplots and render
## Also remove colors from gene track
plot <- trackplot_combine(
list(plot_scalebar, plot_coverage, plot_gene + ggplot2::guides(color = "none"))
)
BPCells:::render_plot_from_storage(plot, width = 6, height = 4)