Plot transcript models
Usage
trackplot_gene(
  transcripts,
  region,
  exon_size = 2.5,
  gene_size = 0.5,
  label_size = 11 * 0.8/ggplot2::.pt,
  track_label = "Genes",
  return_data = FALSE
)
Arguments
- transcripts
Transcipt features given as GRanges, data.frame, or list. See
help("genomic-ranges-like")for details on format and coordinate systems. Required attributes:chr,start,end: genomic positionstrand: +/- or TRUE/FALSE for positive or negative strandfeature: Only entries marked as"transcript"or"exon"will be consideredgene_name: Symbol or gene ID to displaytranscript_id: Transcritp identifier to link transcripts and exons
Usually given as the output from
read_gencode_transcripts()- region
Region to plot, e.g. output from
gene_region(). String of format "chr1:100-200", or list/data.frame/GRanges of length 1 specifying chr, start, end. Seehelp("genomic-ranges-like")for details- exon_size
size for exon lines in units of mm
- gene_size
size for intron/gene lines in units of mm
- label_size
size for transcript labels in units of mm
- return_data
If true, return data from just before plotting rather than a plot.
- labels
Character vector with labels for each item in transcripts. NA for items that should not be labeled
- transcript_size
size for transcript lines in units of mm
Examples
## Prep data
transcripts <- read_gencode_transcripts(
file.path(tempdir(), "references"), release = "42",
annotation_set = "basic", features = "transcript"
)
region <- "chr4:3034877-4034877"
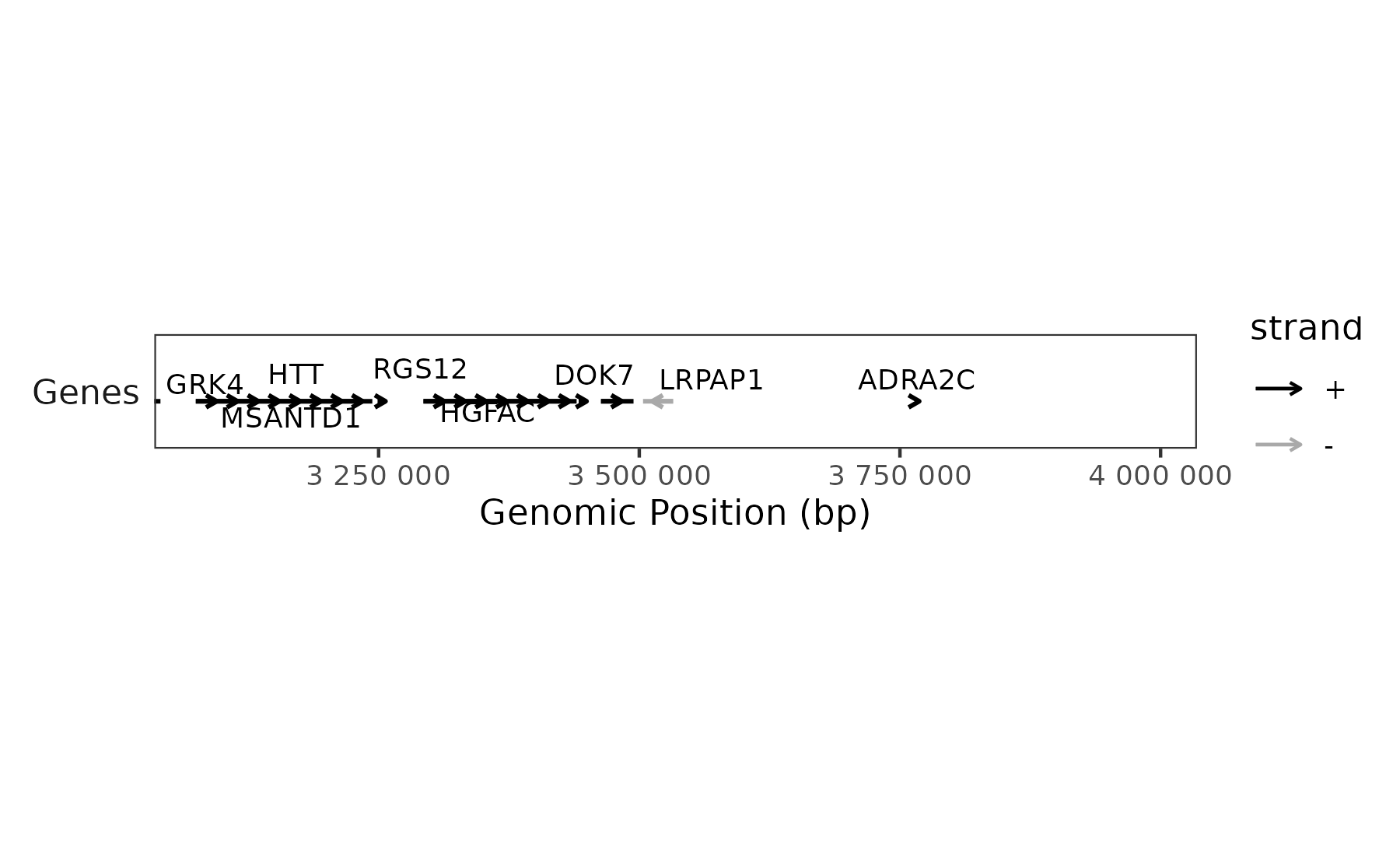
## Plot gene trackplot
plot <- trackplot_gene(transcripts, region)
BPCells:::render_plot_from_storage(plot, width = 6, height = 1)