Plot loops
Usage
trackplot_loop(
  loops,
  region,
  color_by = NULL,
  colors = NULL,
  allow_truncated = TRUE,
  curvature = 0.75,
  track_label = "Links",
  return_data = FALSE
)
Arguments
- loops
Genomic regions given as GRanges, data.frame, or list. See
help("genomic-ranges-like")for details on format and coordinate systems. Required attributes:chr,start,end: genomic position
- region
Region to plot, e.g. output from
gene_region(). String of format "chr1:100-200", or list/data.frame/GRanges of length 1 specifying chr, start, end. Seehelp("genomic-ranges-like")for details- color_by
Name of a metadata column in
loopsto use for coloring, or a data vector with same length as loci. Column must be numeric or convertible to a factor.- colors
Vector of hex color codes to use for the color scale. For numeric
color_bydata, this is passed toggplot2::scale_color_gradientn(), otherwise it is interpreted as a discrete color palette inggplot2::scale_color_manual()- allow_truncated
If FALSE, remove any loops that are not fully contained within
region- curvature
Curvature value between 0 and 1. 1 is a 180-degree arc, and 0 is flat lines.
- return_data
If true, return data from just before plotting rather than a plot.
Examples
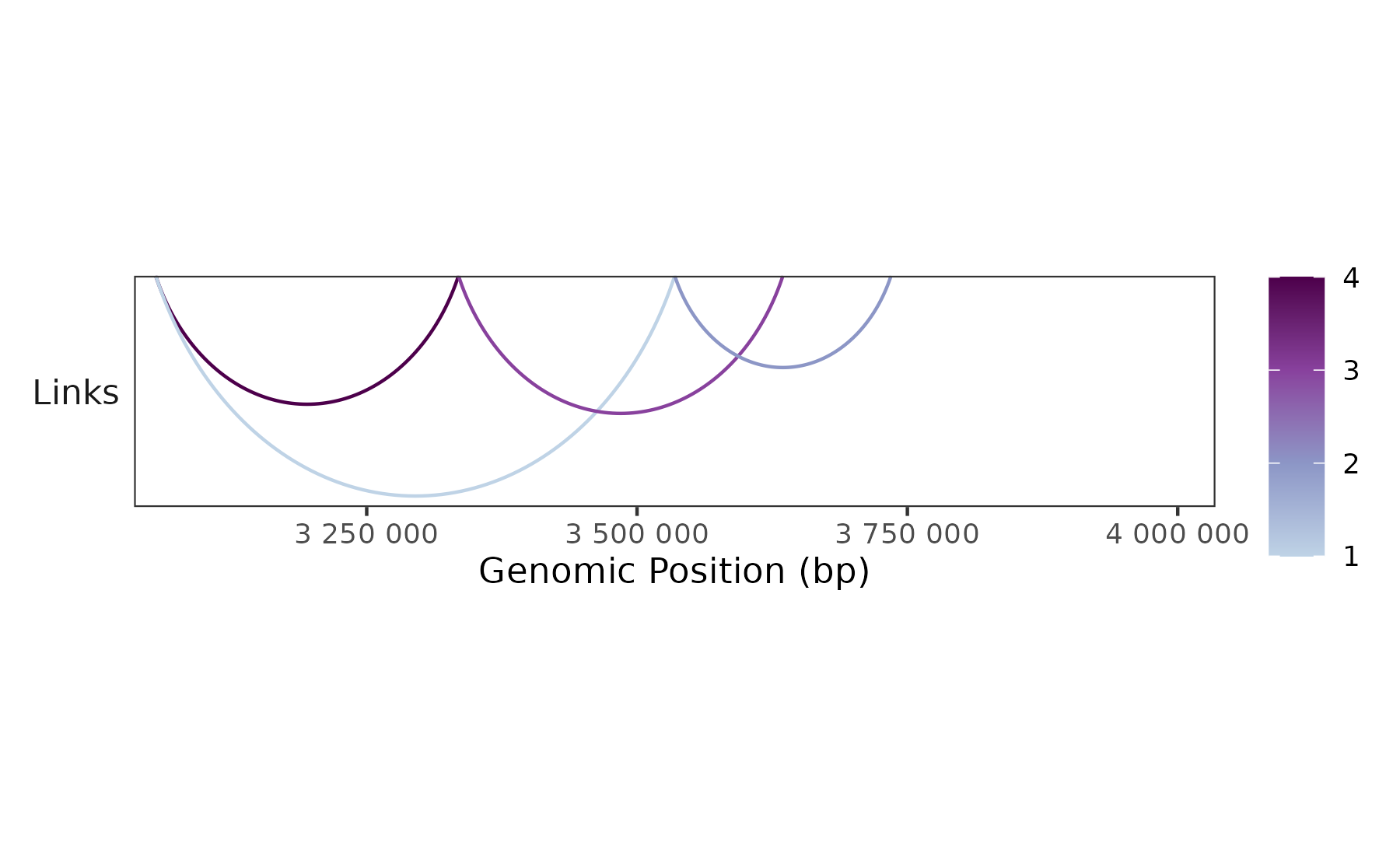
peaks <- c(3054877, 3334877, 3534877, 3634877, 3734877)
loops <- tibble::tibble(
  chr = "chr4",
  start = peaks[c(1,1,2,3)],
  end = peaks[c(2,3,4,5)],
  score = c(4,1,3,2)
)
region <- "chr4:3034877-4034877"

## Plot loops
plot <- trackplot_loop(loops, region, color_by = "score")
BPCells:::render_plot_from_storage(plot, width = 6, height = 1.5)