Plot range-based annotation tracks (e.g. peaks)
Source:R/trackplots.R
trackplot_genome_annotation.RdPlot range-based annotation tracks (e.g. peaks)
Usage
trackplot_genome_annotation(
  loci,
  region,
  color_by = NULL,
  colors = NULL,
  label_by = NULL,
  label_size = 11 * 0.8/ggplot2::.pt,
  show_strand = FALSE,
  annotation_size = 2.5,
  track_label = "Peaks",
  return_data = FALSE
)
Arguments
- loci
Genomic loci given as GRanges, data.frame, or list. See
help("genomic-ranges-like")for details on format and coordinate systems. Required attributes:chr,start,end: genomic position
- region
Region to plot, e.g. output from
gene_region(). String of format "chr1:100-200", or list/data.frame/GRanges of length 1 specifying chr, start, end. Seehelp("genomic-ranges-like")for details- color_by
Name of a metadata column in
locito use for coloring, or a data vector with same length as loci. Column must be numeric or convertible to a factor.- colors
Vector of hex color codes to use for the color scale. For numeric
color_bydata, this is passed toggplot2::scale_color_gradientn(), otherwise it is interpreted as a discrete color palette inggplot2::scale_color_manual()- label_by
Name of a metadata column in
locito use for labeling, or a data vector with same length as loci. Column must hold string data.- label_size
size for labels in units of mm
- show_strand
If TRUE, show strand direction as arrows
- annotation_size
size for annotation lines in mm
- return_data
If true, return data from just before plotting rather than a plot.
Value
Plot of genomic loci if return_data is FALSE, otherwise returns the data frame used to generate the plot
Examples
## Prep data
## Peaks generated from demo frags, as input into `call_peaks_tile()`
peaks <- tibble::tibble(
chr = factor(rep("chr4", 16)),
start = c(3041400, 3041733, 3037400, 3041933, 3040466, 3041200,
3038200, 3038000, 3040266, 3037733, 3040800, 3042133,
3038466, 3037200, 3043333, 3040066),
end = c(3041600, 3041933, 3037600, 3042133, 3040666, 3041400,
3038400, 3038200, 3040466, 3037933, 3041000, 3042333,
3038666, 3037400, 3043533, 3040266),
enrichment = c(46.4, 43.5, 28.4, 27.3, 17.3, 11.7,
10.5, 7.95, 7.22, 6.86, 6.32, 6.14,
5.96, 5.06, 4.51, 3.43)
)
region <- "chr4:3034877-3044877"
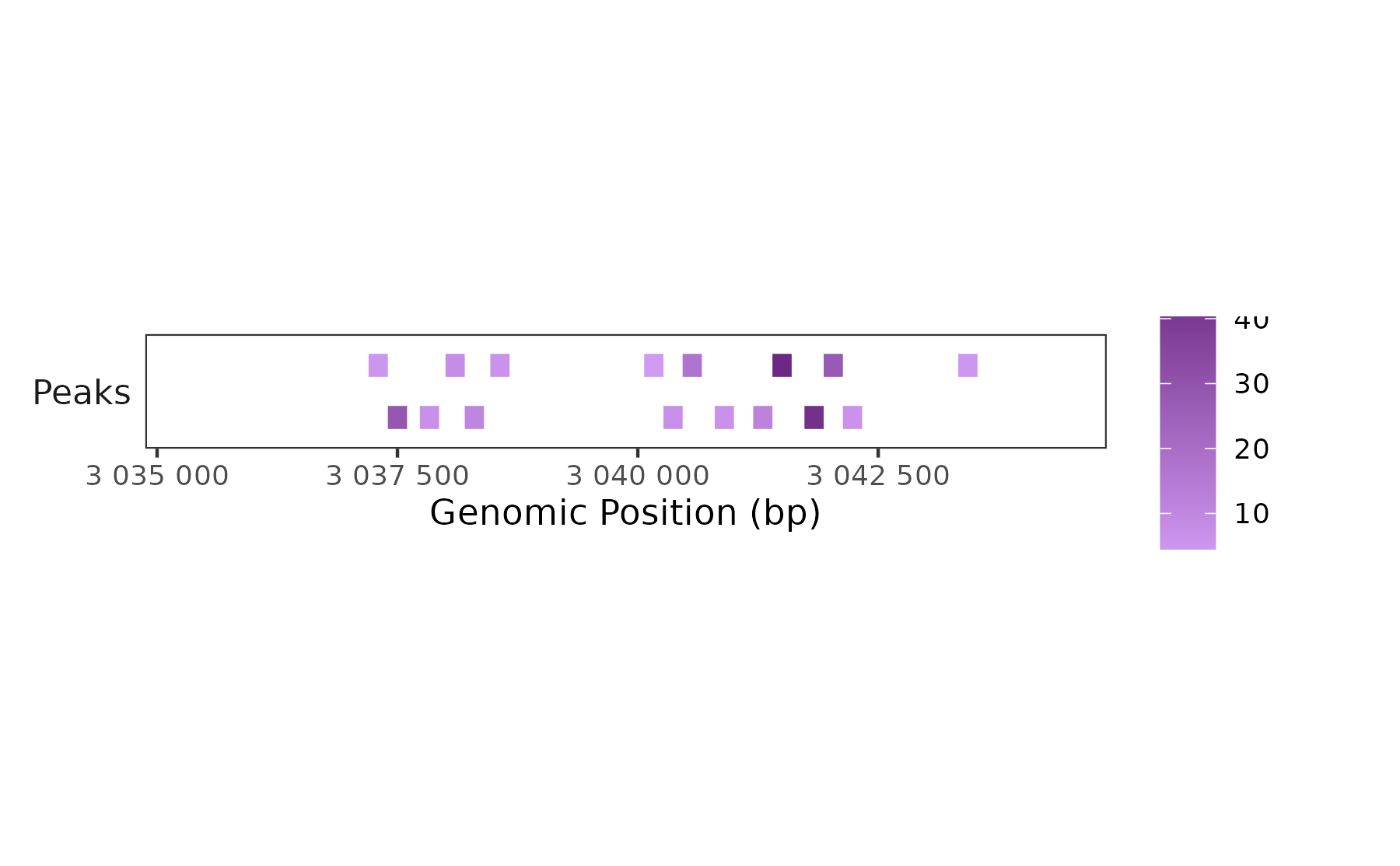
## Plot peaks
BPCells:::render_plot_from_storage(
trackplot_genome_annotation(peaks, region, color_by = "enrichment"),
width = 6, height = 1
)